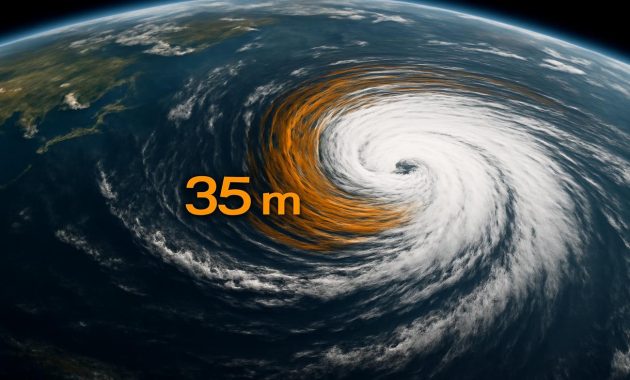
The wave did not roar. It did not crash against a cliff or hammer a lighthouse into splinters. It rose, far from human eyes, in the empty blue heart of the Pacific—thirty-five meters of moving water, a liquid skyscraper rolling across the open ocean in clean, terrifying silence. No ship was there to see it. No buoy bobbed nearby to shriek an alarm. Only a thin, metal bird 800 kilometers above Earth noticed the ocean suddenly heave, breathe deeper, and rise.
When the Ocean Suddenly Stands Up
Imagine you are a satellite, gliding in low orbit over the night side of the planet. Below, the Pacific is a dark, textured sheet, broken only by moonlight glittering like spilled mercury. To your sensors, the ocean is not just blue—it’s data. Minuscule variations in height, temperature, wave patterns, and wind fields ripple across your instruments as numbers, curves, and shifting colors on a screen.
And then something changes.
A pulse. A long, clean swell, far taller than the chaotic chop around it. Not a breaking wave, not a white-fanged storm crest, but a monstrous smooth rise: the open-ocean face of a wave that would tower more than a ten-story building if it rolled beneath a ship.
This is what researchers saw when satellite altimeters and synthetic aperture radar data quietly flagged something unusual in the middle of nowhere: waves reaching around 35 meters—higher than the famed Draupner wave, the rogue giant once thought to be almost mythical. While this oceanic colossus stayed invisible to human eyes, it left fingerprints in the data streams flowing down to Earth, forcing scientists to ask a simple, unnerving question:
How often does the ocean stand up this tall when we aren’t looking?
The Silent Eyes Above the Sea
Most of us imagine satellites as cameras in space, snapping photographs of clouds and continents. But the ones that spotted these titanic Pacific waves don’t care what the water “looks” like. They are more like blind fingers tapping the ocean’s surface from orbit, measuring infinitesimal changes in distance and time.
Satellite altimeters send radio pulses downward and listen for the echo from the sea surface. The time it takes that signal to bounce back tells them how high the ocean is, not in a vague way, but with centimeter-level precision. Pass after pass, orbit after orbit, they sketch a living topography of the sea: the rise of a swell here, the wake of a storm there, the subtle bulge of warm water sliding across the equator.
Then there’s radar—specifically, synthetic aperture radar (SAR), which can see the texture of the ocean even through clouds and darkness. To SAR, waves are patterns of roughness and smoothness, streaks and shadows that hint at wind fields and wave trains marching across the sea. Together, altimeters and radar act like a floating mesh of ghost buoys, giving us what we once thought impossible: a global, near-continuous view of the ocean’s mood.
It was within this digital tapestry that the 35-meter wave revealed itself—not as a photogenic monster curling over a ship, but as a cold, precise spike in an otherwise unremarkable open-ocean swell field. No drama. Just data. The kind that makes oceanographers sit up a little straighter in their chairs.
The Numbers Behind a Giant
To grasp the scale of these waves, you have to imagine how unremarkable the open ocean usually looks. Far from coasts, waves roll in clean, spacious swells—gentle hills of water that might lift a ship a few meters at most. Even storm seas are mostly chaotic, stacked crests and troughs, with rare peaks and lulls.
But a 35-meter wave? That’s different. That’s not just a tall crest—it’s an outlier, an extreme, the kind of spike that tells you the ocean is capable of more than your models politely predicted.
Here’s one way to picture it: stand at the base of a typical 10-story building and look up. Now imagine that whole height moving toward you, not as a wall breaking at the shore, but as a long, smooth swell in deep water. To a ship caught on its front face, the horizon would vanish behind a steep ramp of green water. For a brief moment, the vessel would be climbing a mountain.
Rogue Waves, Rewritten
Rogue waves used to live mainly in sailor’s stories. They were called “freak waves,” “monster waves,” or “walls of water”—tales of sudden, impossible mountains rising from nowhere to smash ships and rigs. For a long time, ocean science treated those accounts with caution. Waves that were twice as high as anything around them didn’t fit the tidy bell curves of traditional wave statistics.
That changed on New Year’s Day, 1995, when a wave measuring about 25.6 meters slammed into the Draupner oil platform in the North Sea. For the first time, a proper scientific instrument was in the right place at the right time to record a rogue wave in cold numbers. The myth became measurable.
Since then, oceanographers have been recalibrating their ideas about what the sea can do. Satellite data has been quietly revolutionary in this process. Instead of relying on scattered buoys, the odd platform sensor, and the stories of shaken crews, we now have a global, long-term survey of wave heights. We can look not just for one giant wave, but for patterns—for how often rare giants appear, in what conditions, and in which corners of the ocean.
What the recent detections in the Pacific suggest is that the word “rare” might be more complicated than we thought. Rogues are still extraordinary, but perhaps not as vanishingly improbable as older theories assumed. The ocean, under the right combination of winds, currents, and overlapping swells, seems more willing than we realized to produce these brutish, reality-bending waves.
A Quick Look at Wave Scales
To ground the story in something visual, here’s a simple comparison of typical wave heights versus the giants spotted by satellites:
| Wave Type | Approximate Height | Human-Scale Comparison |
|---|---|---|
| Small coastal waves | 0.5–1.5 m | Around knee- to head-high |
| Typical open-ocean swell | 2–5 m | Single-story house |
| Severe storm waves | 10–15 m | Three- to five-story building |
| Recorded rogue waves (e.g., Draupner) | 25–26 m | Eight- to nine-story building |
| Satellite-detected Pacific giants | Up to ~35 m | Roughly ten- to twelve-story building |
On a mobile screen, those numbers feel almost abstract, but the gap between 15 and 35 meters is more than just “twice as high”—it’s a leap into a different category of stress for any hull, any offshore structure, any human heart watching the sky disappear behind a moving wall.
The Making of a Monster Wave
Out in the Pacific where these waves were detected, there were no cliffs to focus and rebound the swell, no shallow banks to trip it into breaking, no dramatic coastline to frame it in spray and thunder. Just water, deep and blue and seemingly endless. So how does such a wave arise out there, in the ocean’s mid-latitudes or storm tracks, where the horizon is a perfect circle?
The answer is not one thing, but many. Start with wind—strong, sustained, and blowing across long distances. The longer the fetch, the more energy the wind can feed into waves. Layer storm systems on top of one another. Swells from different storms, traveling at slightly different speeds and angles, begin to intersect. Where their crests align, they add; where troughs meet crests, they cancel.
Most of the time, this interference creates a messy but statistically predictable sea. Yet, under certain conditions, the wave field can sharpen, focusing energy into fewer, steeper crests. Nonlinear interactions—subtle energy exchanges between waves—can pump extra power into a small subset of them, like a crowd rhythm suddenly snapping into a single, powerful chant.
That’s when a rogue can emerge: a crest far higher and steeper than its neighbors, sometimes riding over the shoulders of several underlying swells like a heavyweight boxer suddenly rising above a jostling crowd. Satellites can’t feel the shock in a sailor’s knees when that happens, but they can see the elevated surface, the sudden spike written into the ocean’s profile.
Invisible Drama in the Middle of Nowhere
One of the strangest parts of these discoveries is their quietness. No viral video of a ship diving into the trough. No shaky phone footage of crew members cursing into the wind. Just lines of data, months or years old, combed through by researchers who notice a blip—a surge in significant wave height here, a pattern of extreme crests there.
In a way, it makes the ocean feel larger, more aloof. These aren’t waves performing for us along a tourist shoreline. They are private convulsions, deep-ocean gestures that come and go whether or not anyone is watching. Only now, with our instruments orbiting overhead, we are beginning to eavesdrop on that private language.
Why These Giants Matter to People Far from the Sea
You could argue that a 35-meter wave breaking itself to pieces in a remote patch of the Pacific has nothing to do with a person sitting in a landlocked city hours from the nearest shore. No one saw it. No ship crossed its path. The world kept turning.
But understanding extremes shapes how we build and plan. Modern cargo ships are floating skyscrapers of steel and containers, longer than some city blocks. Offshore platforms tap energy from beneath the seafloor. Wind farms march ever farther from the coast. All of these structures are designed based on our understanding of what the ocean is likely to do to them.
If the probability of rogue waves is slightly higher than we used to believe—or if their potential height is greater—then the safety margins built into maritime engineering start to look thinner. Insurance models, routing software, offshore regulations, even the design of future ocean-based renewable energy systems all depend, quietly, on where we draw the line between “extreme but possible” and “almost never.”
There is another, subtler reason these waves matter. They remind us that the ocean climate itself is changing. As wind patterns shift, storms intensify, and temperature gradients across the sea alter, the way energy moves through the wave field will change too. Satellites give us a long memory, a record that future scientists can look back on to ask: did rogue waves become more common? Did storm seas grow more violent? Were there turning points we only recognize in hindsight?
The Human Imagination Meets the Satellite Age
Long before satellites or steel hulls, people stood on shores and stared at the sea with equal parts fear and reverence. In stories, waves were often more than physics—they were moods, punishments, embodiments of gods or monsters. Entire cultures grew up reading the sea’s skin: the way a swell steepened, the color of breaking foam, the hum in the wind before a storm.
Now, many of us encounter the ocean mostly through a screen: a photograph of distant surf, a drone shot of tidy, curling lines, a map of wave forecasts color-coded in blues and reds. When we talk about 35-meter waves detected by satellites, it can sound abstract, almost like a glitch in a simulation.
Yet beneath the data lies the same old, physical sea—molecules piled on molecules, shaped by gravity, wind, and the spin of the Earth. The satellites are just our newest way of listening, an extension of the human urge to understand the thing that both feeds and unnerves us. The numbers they send back are not replacing the awe; they are deepening it, adding a layer of invisible drama to that distant, glittering blue on the map.
Living with a Restless Planet
The discovery of titanic waves in the Pacific doesn’t mean the ocean is suddenly more dangerous than it used to be. Those waves were always there, in one form or another, rising and falling beyond our notice. What has changed is our ability to see them—and through them, to glimpse the true spread of possibilities in a system we once thought we could neatly box with statistics.
In the years ahead, more satellites will join the watch: sharper radar eyes, more precise altimeters, constellations that can pass over the same patch of sea multiple times a day. Machine learning systems will sift their data, flagging anomalies that human analysts may have missed, reconstructing the birth and death of giant waves that no one ever saw. Our maps of “normal” and “extreme” will shift. Some old assumptions will quietly retire.
Still, there will always be a gap—an unbridgeable space between data and experience. No number, no matter how exquisitely measured, can fully capture the vertigo of standing on a deck as a wave blots out the sky. No graph can quite contain the feeling, as a satellite passes overhead, that far below, the planet is not a static blue marble, but a living, heaving body of water constantly rehearsing its own extremes.
In that sense, the 35-meter waves of the Pacific are not just curiosities or engineering challenges. They are reminders. That the world is still wilder than our models. That somewhere, tonight, in a stretch of black water between continents, the ocean may again decide to stand up a little taller than we thought it could—unwatched, unphotographed, but not entirely unseen.
Frequently Asked Questions
Are 35-meter waves the largest waves the ocean can produce?
Not necessarily. They are among the largest reliably detected in open water, but models and some observations suggest that even taller waves may occasionally form under extreme conditions. The key point is that such waves are very rare and short-lived, which makes them difficult to measure directly.
Could a wave this big reach the coast?
Most 35-meter-class waves identified by satellites occur far offshore in deep water and are part of chaotic storm seas. As they travel toward shallower regions, they transform—often breaking or dispersing. Coastal waves can be very large during storms, but the exact deep-ocean rogue wave rarely arrives at shore as the same towering crest.
Do satellites see every rogue wave?
No. Satellites sample the ocean along narrow tracks at specific times. A rogue wave that forms and disappears between passes can go unnoticed. However, the growing number of satellites and improved sensors dramatically increase the chances of catching these extremes often enough to understand their statistics.
Are rogue waves becoming more common with climate change?
Scientists are still investigating this. Climate change is altering storm patterns and wind fields, which in turn affect waves. Some studies suggest potential increases in extreme wave heights in certain regions, but the picture is complex and still emerging. Long-term satellite records are crucial for answering this question.
How do these discoveries affect ship and offshore platform design?
Engineers use information about extreme wave statistics to set design standards and safety margins. As our understanding of rogue waves improves, it can lead to updated guidelines for hull strength, platform elevation, and operational procedures—especially in high-risk regions like major storm tracks or strong current systems.