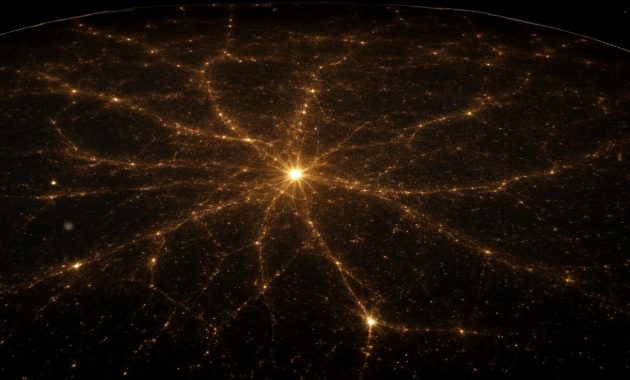
The first thing you notice is the silence. Not the quiet of a forest at dawn or a city at 3 a.m., but a silence so large it feels like a physical thing. You’re staring at a dark screen, waiting. Somewhere, in a data center cooled by roaring fans and fluorescent light, a supercomputer is stitching together a new kind of map—one that doesn’t show rivers or roads or national borders, but something much older and wider. Then, like stars slowly appearing at dusk, the screen begins to fill with points of light. One dot. Then a thousand. Then a million. And then, impossibly, tens of millions.
This is what 80 million galaxies look like when you try to catch them all in one frame: not like an elegant spiral drawn on a textbook page, but like spilled sugar scattered across a dark tablecloth. Each grain is a city of suns. Every single one is a galaxy, and every galaxy holds billions of stars, and every star might hold worlds. You are looking, in some sense, at an anthology of everything that could ever exist.
The Night Sky, Suddenly Too Small
Most of us meet the universe as kids lying on our backs, necks aching, tracing constellations we didn’t name and stories we didn’t write. The sky feels crowded then, freckled with stars. But that sky—the one we grew up with—is a wild illusion of scale, the cosmic equivalent of looking at the ocean from the shore and thinking you’ve seen it all.
Even if you live under a truly dark sky, with no city glare and no moon, your naked eyes can see only a few thousand stars at best. A tiny skin of light. You might spot a fuzzy patch that is the Andromeda galaxy, a few other smudges if you know where to look. But the real universe—its structure, its drama, its sheer number of things—has been hiding just beyond the thin limits of our eyes.
So in recent years, astronomers decided to cheat. They built machines that can stare longer, see deeper, and remember more than any human ever could. Telescopes no longer work alone like solitary mountaintop monks. They are partnered with cameras that snap the sky again and again, night after night, and computers that patiently sort through this avalanche of photons. The result: a three-dimensional census of the cosmos.
When scientists say they’ve just mapped 80 million galaxies, what they really mean is that they’ve assembled the most detailed roll call of the universe’s visible matter we’ve ever had. It’s not a pretty picture meant to be framed and hung on the wall; it’s a working map, dense and cluttered and mathematical. Every dot is tagged with position, distance, and brightness. Every region of emptiness is just as important as the clusters of light.
The Telescope That Took a Deep Breath
Imagine a camera not the size of your hand, but the size of a small car. Bolted to a telescope so wide you could park a truck inside its open dome. Its job: scan huge swaths of the sky night after night, drinking in starlight that left its home billions of years ago.
These galaxy maps come from massive sky surveys—long, patient projects that quietly collect light while most of the world sleeps. One of the telescopes involved in this era of mapping, the kind that makes numbers like “80 million galaxies” possible, does something beautifully simple: it takes repeated images of the same patches of sky in different colors of light. Each exposure is one frame in a time-lapse of the universe.
The raw data is anything but poetic. It’s lines in a file, measurements and timestamps, exposure times and coordinates. To human eyes, it’s impenetrable. But fed to a supercomputer and guided by clever algorithms, those lines bloom into a full-sky map where each little smudge of light is classified, cataloged, and assigned a probable distance.
In this work, telescopes don’t so much “discover” galaxies as recognize them. Amid cosmic dust, sensor noise, asteroid streaks, and satellite trails, the software has to decide which flecks of brightness are stars from our own galaxy and which are distant galaxies far beyond. Multiply this act of cosmic sorting by billions, and you begin to sense the scale of the problem—and the quiet audacity of solving it.
Reading the Universe in Bulk
Once the galaxies are mapped, astronomers don’t study them one by one like rare butterflies pinned to a board. Instead, they step back. They look for patterns—how galaxies clump together into filaments and walls, how they leave behind great voids of almost nothing at all. When you zoom out far enough, the universe starts to look less like scattered glitter and more like a vast, lacy web: bright strands and knots of galaxies wrapped around invisible pockets of emptiness.
That web is not random. It’s the fossil record of how the universe has been growing and stretching since the Big Bang, shaped by gravity, dark matter, and an even stranger force: dark energy. These galaxy maps are like a set of fingerprints pressed into the fabric of space-time. By measuring them carefully—how far apart galaxies are, how they cluster at different distances—scientists can test their deepest ideas about what the universe is made of and how it behaves.
They can measure how fast space itself is expanding. They can probe whether dark energy, the mysterious pressure causing that expansion to accelerate, has always behaved the same way or is changing over time. They can weigh the influence of dark matter—the invisible scaffolding that galaxies hang on. All of that is encoded in the way 80 million galaxies share the sky.
What 80 Million Galaxies Feel Like
Numbers this large flatten the imagination. Eighty million. You can say it, write it, nod politely at it, and still not really feel what it means. So, consider this: if each galaxy in this map were a single grain of fine sand, you could pour them into a tall glass and it would overflow—an ordinary object suddenly made extraordinary by what each grain represents.
Hold that imaginary glass in your hand. Every grain is a galaxy. Many of those galaxies hold hundreds of billions of stars. Most of those stars likely have planets. Some of those planets may have oceans, weather, chemistry, perhaps even life. In that glass, you hold enough stars to outnumber every word ever spoken by humans in all of history. Enough planets to make our single, blue world feel like a punctuation mark.
Yet even 80 million is not all there is. It’s just the portion we’ve managed to chart so far with this particular method, this particular set of eyes. The full observable universe likely holds on the order of two trillion galaxies. What we have now is not a picture of everything, but a meticulously drawn sample—a section of the forest large enough to tell us what the whole forest is doing.
This is what makes these new maps feel almost paradoxical: they shrink and enlarge us at the same time. On the one hand, we are clearly microscopic, clinging to a fragile rock on the outskirts of an ordinary galaxy in a universe that doesn’t even notice we’re here. On the other hand, we, the fragile creatures, have built instruments and ideas capable of measuring what the universe is made of. We may be small, but we are not blind.
Turning Sky into Spreadsheet
If you could peek behind the curtain of this cosmic cartography, you’d see not just telescopes but endless tables—columns of numbers and flags and categories. It’s not glamorous at first glance. Each galaxy becomes a row in a gigantic database: a unique ID, a position in the sky, a measured brightness in multiple colors, an estimated distance, sometimes a redshift that reveals how fast it’s moving away from us.
Because our universe is vast and the data are dense, scientists rely heavily on automation. Machine learning is trained to tell the difference between nearby stars and distant galaxies, between smooth elliptical galaxies and spirals with bright arms, between genuine signals and random noise. In all that, errors are inevitable, so surveys cross-check with others, compare methods, reanalyze. Mapping the universe is less like snapping a photograph and more like slowly developing a mural, layer upon layer, each one refined by the last.
To sense how astronomers work with such a volume of information, imagine scrolling a spreadsheet that never ends. Every line is a galaxy; every cell is a clue. Here’s a simple way to think about the scale and content of such a survey:
| Survey Feature | Typical Value | What It Means |
|---|---|---|
| Number of Galaxies | ~80,000,000 | Each one is a collection of billions of stars. |
| Sky Coverage | Thousands of square degrees | A large fraction of the entire visible sky. |
| Depth | Billions of light-years | We see galaxies as they were far in the past. |
| Measured Properties | Brightness, color, shape, redshift | Used to infer distance, type, and motion. |
| Primary Science Goals | Dark energy, dark matter, cosmic structure | Understanding what the universe is and how it evolves. |
All this tabular order underpins the awe. The beauty of the final map—the graceful arch of galaxies across the sky—rests on the robustness of rows and columns carefully wrangled from photons that began their journey before Earth even existed.
Listening for the Echoes of Dark Energy
At the heart of this effort lies a quiet, profound question: Why is the universe speeding up?
Gravity, as we know it, should be pulling everything back together like a tightened net. But the distant galaxies mapped in these surveys tell a different story. Their light stretches as it travels to us, its wavelengths reddened by the expansion of space itself. By measuring that stretching—redshift—and comparing it to how galaxies are distributed in space, scientists can reconstruct how fast the universe has been expanding at different times in its history.
What emerges is a narrative both unsettling and exquisite. In its early days, the universe’s expansion slowed under the heavy hand of gravity. But a few billion years ago, something shifted. The expansion began to accelerate, as if a hidden pressure had started to dominate, pushing galaxies apart faster and faster. We call that “something” dark energy—not because we know what it is, but because we don’t.
A Cosmic Weather Report
Galaxy maps act like a long-term weather record for the universe. They don’t just show us where things are; they reveal how the cosmic climate has changed. Are structures forming at the rate we expect? Are galaxies clumping together under gravity the way our theories predict? Or is there a subtle mismatch, a quiet rebellion against our equations?
By comparing the observed distribution of those 80 million galaxies to simulations—virtual universes grown inside computers—scientists can tweak the knobs on their models of dark energy and dark matter. If a particular combination reproduces the cosmic web we see, it earns a provisional place in our story of the universe. If not, it’s back to the drawing board.
In this way, every dot in that map, every distant galaxy just barely above the noise, becomes a data point in an ongoing debate about reality’s deepest rules. The galaxies themselves are not aware of this, of course. They’re busy colliding, forming stars, and occasionally shredding each other under gravity. But from our small perch, we are listening, attentive, measuring the echoes of a force we cannot yet name.
The Human Thread in the Cosmic Tapestry
It’s tempting to imagine this whole enterprise as something cold and robotic—telescopes humming, algorithms churning, data streaming. But if you visit an observatory control room at night, you find something very human humming underneath: drowsy laughter over mugs of coffee, ritual superstitions about “jinxing” good weather, quiet rituals of checking and rechecking settings before a critical exposure.
The scientists who map galaxies are not distant from the wonder. Many of them were once kids staring up at the same crowded night sky we all inherit. They simply never stopped asking, “What’s really out there?” Except now they can answer in a way no generation before them could: “We have a map. Not a complete one, but vast enough to trace the universe’s bones.”
These maps are not just tools for professionals, either. Many surveys release their data to the public. Citizen scientists help classify galaxy shapes. Students use real astronomical catalogs to learn statistics and coding. In some cases, a curious person with a laptop and a free afternoon can sift through the same universe-scale spreadsheets as experts, chasing their own questions through the rows.
The act of mapping has always been a deeply human one. We mapped coastlines to understand trade and tide. We mapped continents to understand migration and empire. Now we map galaxies to understand something far more elusive: not just where we are, but what “where” even means when space itself is stretching beneath our feet.
Standing at the Edge of the Known Map
There’s a famous image of old Earth maps with sea monsters doodled into the blank parts, a whimsical confession: “Here be dragons.” Today’s cosmic maps have no dragons, only margins where the data grow thin and the uncertainties large. But they carry the same invitation: beyond this line lies more.
Future surveys will go deeper and wider, counting not tens of millions but potentially tens of billions of galaxies. New telescopes will look in different wavelengths—infrared, radio, X-ray—each revealing another layer of structure. We’ll don new sets of glasses and see different universes superimposed on the one we know: the hot gas, the cold dust, the mysterious lensing fingerprints of dark matter.
But even when those maps arrive, even when the spreadsheets swell to impossible sizes and the simulations grow more precise, there will still be that moment of simple, almost childlike wonder: staring at a field of points and realizing each one is an island of stars, and that we, against all odds, have learned to chart them.
Somewhere tonight, while most of the world is asleep, a telescope will open its eye and take another step in this grand slow-motion survey. A faint galaxy, too dim for any human eye, will leave its mark on a sensor. Later, in some lab or office, its coordinates will be added to a catalog—a new row, a new dot on an ever-expanding map. Another whispered “Here” in a universe that, for the first time in its history, is being painstakingly, lovingly, measured by one of its own tiny inhabitants.
FAQ
What does it mean to “map” 80 million galaxies?
Mapping galaxies means measuring their positions on the sky, estimating their distances, and recording properties like brightness, color, and shape. Instead of a flat picture, astronomers build a three-dimensional map that shows where galaxies are in space and how they cluster together.
How do scientists know how far away these galaxies are?
They measure a property called redshift—how much a galaxy’s light is stretched toward the red end of the spectrum as the universe expands. The greater the redshift, the farther away (and the earlier in cosmic history) the galaxy generally is. Combined with models of cosmic expansion, redshift becomes a kind of distance ruler.
Why do astronomers need so many galaxies in one map?
The large-scale structure of the universe only becomes clear when you have enormous samples. With tens of millions of galaxies, scientists can see patterns—clusters, filaments, and voids—and use those patterns to test theories about dark matter, dark energy, and how fast the universe is expanding.
Is 80 million galaxies all the galaxies in the universe?
No. It’s just a fraction of what we can observe, and an even smaller fraction of what exists beyond the observable universe. Current estimates suggest the observable universe may contain on the order of two trillion galaxies. The mapped 80 million form a carefully measured sample large enough to reveal the universe’s overall structure.
Can ordinary people access these galaxy maps?
Yes, many major sky surveys eventually make their data publicly available. While the raw catalogs are technical, there are also simplified tools and citizen-science projects that let non-specialists explore images of galaxies and even help classify them, bringing the cosmic map a little closer to anyone who wants to wander it.