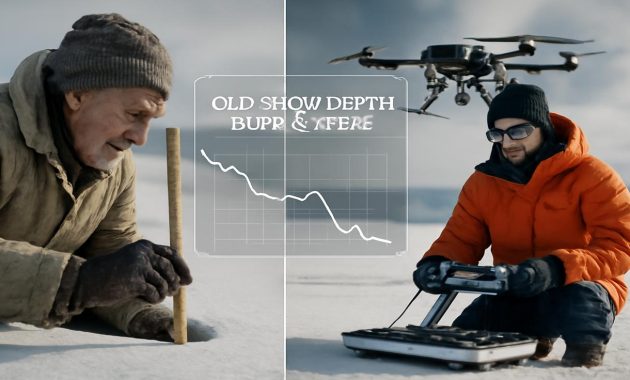
The first time you hear snow, really hear it, is usually when it’s too quiet for anything else. In the high Arctic, that quiet can feel almost otherworldly. The wind pauses. The sky presses low and gray. And all at once, you notice the soft hiss of flakes sliding over one another, building tiny cornices at your feet, smoothing the sharp edges of a frozen world. For decades, scientists believed they understood this snow—the depth of it, the rhythm of its seasons, the way it locked the Arctic into a bright, reflective shell every winter. But somewhere along the way, the snow slipped out of the story they thought they were telling.
The Old Map of a Changing World
In the early 1960s, long before satellites could watch the poles blink from space, Arctic snow was mostly a matter of boots, rulers, and notebooks. Researchers flew into remote weather stations, trudged across wind-scoured tundra, jabbed stakes into drifted snow, and logged the numbers. Snow depth. Density. Snow water equivalent. Date. Location. Repeat, year after year.
That work became the backbone of what many call the “golden record” of Arctic snow data: six decades of observations stretching from Alaska’s North Slope across Canada, over Greenland, and into Siberia. These records fed into climate models, water forecasts, wildlife studies, and international climate assessments. They were, in many ways, how we thought we knew the Arctic winter.
But those measurements were never as simple as they looked. A single snow stake might stand in for hundreds of square kilometers. A drifting winter storm could pile snow five meters deep in one hollow while scraping it bare from a nearby ridge. And when satellites finally came along to scan the Arctic’s white expanse, they brought a different kind of vision—broad and consistent, but indirect, inferring snow from brightness or microwave signals rather than feeling it underfoot.
For years, these two worlds—boots-on-the-ground and eyes-in-the-sky—coexisted in a kind of uneasy truce. The satellite data were calibrated and tuned against the older station records. Models were nudged until they could more or less reproduce what those handwritten logs seemed to say. It was messy but workable.
Then, as the twenty-first century deepened and the Arctic began warming four times faster than the global average, the cracks in that old map widened. Snow was arriving later, melting earlier, and behaving badly—at least, badly compared to what the models expected. Suddenly, the once-settled history of Arctic snow didn’t look so solid.
The Moment of Doubt
There’s a particular kind of silence that settles over a lab when a plot on a computer screen refuses to make sense. You’ve checked the code, the data, the equations. You’ve gone back over the instrument manuals, the archived logs. You stare at the line that should slope one way but slopes another, and you feel, in the pit of your stomach, the possibility that you have misunderstood something fundamental.
For Arctic snow scientists, that moment has come more than once in recent years. One team noticed that satellite estimates of snow water equivalent—a measure of how much water is locked in the snowpack—weren’t lining up with station records, especially in regions with dense shrubs and changing vegetation. Another group found that some “long-term” snow records had gaps, relocations of weather stations, or changes in measuring practice that quietly warped the trends over time.
Then came the field campaigns—intensive, boots-on-the-ice expeditions where ground teams marched along satellite flight paths, measuring snow with everything from old-fashioned cores to high-tech radar sleds. The idea was simple: compare what the satellite thought it was seeing with what people could physically dig, weigh, and touch.
In many places, the answer was: not the same thing at all.
The satellites were easily fooled by ice layers, crusts, and melt–refreeze cycles. Complex snowpacks looked deceptively simple from orbit. Shrubs poking through thin snow made signals that resembled thicker, denser snow. Wind-scoured ridges with hard drifts triggered readings that didn’t match the actual water content. And the ground-based measurements, it turned out, were also far from perfect—often too sparse, too localized, too influenced by the idiosyncrasies of one technician’s method versus another’s.
What emerged from this confusion wasn’t just a modest correction to a dataset. It was a humbling realization: we might not know the Arctic’s snow history as well as we thought we did.
The Hidden Biases Buried in Snow
Some of the problems were almost mundane once someone pointed them out. A weather station is moved a few kilometers from a windswept ridge into a slightly sheltered valley. Snow depths rise—in the record, it looks like a climate trend. A new observer replaces an older one and consistently clears the measuring board more carefully, capturing early flakes that used to be missed. Suddenly, the “start” of snow season appears to creep earlier in the data.
Instrumentation upgrades created their own quiet revolutions. A change in how snow depth was measured—a different type of stake, a sonic sensor, a new algorithm to clean the signal—could shift a station’s apparent baseline. Over 60 years, those small shifts accumulate like layers in a snowpack, buried but potent.
Then there are the things no one could easily control. The Arctic landscape itself has been changing under the instruments’ feet. Permafrost is thawing, causing ground to subside, tilt, or slump. Shrubs are invading the tundra, trapping snow in ways that amplify local depth. Sea ice, once stable and thick, has become younger and thinner, changing where and how snow accumulates on its surface. All these processes warp the meaning of any single number: “snow depth: 24 centimeters” in 1973 may not be the same ecological reality as “24 centimeters” in 2023.
Scientists began to see the station records less as precise thermometers of climate and more as complex stories written in shorthand—truthful in spirit, but full of shorthand, quirks, and missing context. To keep using them as the bedrock of Arctic snow science, they realized they would need to read those stories more carefully.
Rewriting the Arctic’s Winter Diary
Rethinking six decades of data does not mean throwing them out. It means asking harder questions: What, exactly, were we measuring? How did our tools shape what we saw? Where do different data sources agree, and where do they diverge?
In practice, this has turned into an enormous detective project. Teams pore over old station logs, looking for notes about relocations, changes in observers, or unexplained shifts in readings. Statistical methods are used to spot “break points” in time series—moments when a station’s behavior suddenly changes in ways that don’t match its neighbors. These breaks can signal a non-climatic cause: a new instrument, a move, a different sampling routine.
At the same time, new observing systems are being layered onto the old ones. Satellites with higher resolution and different sensor types are being cross-calibrated with airborne lidar and radar, unmanned drones, and on-the-ground campaigns. Instead of treating one dataset as the absolute “truth,” scientists now weave multiple lines of evidence into a more nuanced picture.
A core part of this rethinking is recognizing that snow is not just depth. In the Arctic, snow is thickness and density and layering; it is hardness, grain size, water content, and impurity load. A light, fluffy 30-centimeter layer that fell in a quiet cold snap behaves very differently from a wind-packed, ice-crusted slab of equal depth that has been tortured by storms. For sea ice, for wildlife, for hydrology, these details matter as much as the headline number.
Modern campaigns now measure that complexity with almost obsessive detail—drilling cores, weighing them, slicing them, scanning them with radar and micro-CT, tracking how they evolve through the season. This new richness can’t retroactively fix the 1960s logbooks, but it can help reinterpret them: given what we know now about how snow behaves in certain conditions, what was likely happening back then, beyond the single number that got written down?
What We Thought We Knew vs. What We’re Learning
To appreciate how this rethinking plays out, it helps to put the “old” and “new” stories side by side. The table below summarizes a few of the key shifts in understanding.
| Aspect | Traditional View (Last 60 Years) | Evolving View (Today) |
|---|---|---|
| Data reliability | Long-term station records treated as stable, mostly unbiased baselines. | Recognized as valuable but patchy, with hidden biases from station moves, method changes, and landscape shifts. |
| Snow depth vs. snow water | Depth often used as a stand-in for total snow mass or water content. | Depth alone is insufficient; density, layering, and timing critically shape real impacts. |
| Satellite calibration | Satellites tuned to match ground records, assuming those are correct. | Two-way checking: satellites and ground data both interrogated; mismatches highlight unknowns. |
| Role of vegetation | Shrubs and tundra plants mostly background scenery in snow datasets. | Vegetation actively reshapes snow distribution and signals, especially as shrubs expand. |
| Use in climate models | Arctic snow represented with simple, broad brush assumptions. | Models being upgraded to reflect complex snow processes, feedbacks, and uncertainties. |
These shifts might sound technical, but they cascade into very tangible questions. How much spring meltwater will pour into Arctic rivers? How stable is sea ice for hunters traveling by snowmobile? How often will rain fall on snow, encasing it in ice that caribou can’t dig through? The answers all depend on getting snow right—or at least, less wrong.
Why Rethinking Snow Matters for the Whole Planet
To someone living far from the Arctic, this may feel like a distant bookkeeping problem: scientists fine-tuning numbers in a cold place. But Arctic snow is woven into the climate system that touches every coastline and crop field.
Snow is the Arctic’s natural mirror. Thick, bright snow cover bounces sunlight back into space, cooling the planet. When snow thins or melts earlier, darker land and water absorb more heat, amplifying warming in a feedback loop. Even small errors in estimating how much snow is there—and when it disappears—can lead climate models to misjudge how fast the Arctic will warm and, in turn, how sea levels and weather patterns elsewhere will respond.
Snow also dictates the fate of Arctic freshwater. It stores winter precipitation and releases it in spring pulses that feed rivers, wetlands, and coastal ecosystems. If scientists underestimate or overestimate the total snow water, they can miscalculate flood risks, nutrient flows, and the timing of freshwater pouring into the Arctic Ocean—changes that can ripple through fisheries and ocean circulation.
For people who live in the Arctic, the stakes are even more immediate. Hunters, herders, and communities have spent generations reading snow with a kind of precision no satellite can match: the way it sounds under a sled runner, the color shift that hints at thin ice beneath, the scent of wet snow that signals an incoming thaw. Their knowledge often clashed with model outputs that declared conditions to be “normal” while local experience screamed otherwise.
As scientists reassess the data, there is growing recognition that Indigenous observations are not anecdotal add-ons but crucial, independent lines of evidence. When a community notes that freeze-up now comes weeks later, or that rain-on-snow events have become dangerously frequent for reindeer herding, those testimonies can help flag where the historical record might be missing something or where a model’s confident line on a graph masks deep uncertainty.
Peering Forward with Clearer Eyes
Rethinking 60 years of Arctic snow data is not a neat, one-time correction. It is more like lifting a snow-laden roof, beam by beam, to see which pieces are solid and which are rotting from within. It demands a willingness to live with error bars, to admit that some cherished trend lines may blur or bend when reanalyzed, and to embrace new tools that may contradict old baselines.
Yet there is a quiet optimism in this work. Each reevaluated station, each cross-checked satellite pass, each shared story from a hunter who has watched the snow change over a lifetime, adds nuance to our picture of the Arctic. Climate models that once treated snow as a uniform blanket can gradually learn to mimic its patchiness, its restless shifting, its fragile, layered memory of each winter’s storms.
In the near future, the Arctic’s winter diary may look very different from the version we’ve been reading for decades. Some apparent long-term increases or decreases in snow depth may soften, revealing that part of the story was hidden in measurement quirks. Other trends—such as the shift toward earlier spring melt and more midwinter thaw events—will likely emerge as even more pronounced than we realized once biases are corrected.
None of this uncertainty erases the broader trajectory: the Arctic is warming rapidly, and snow is changing with it. But by scrutinizing the past more honestly, scientists hope to sharpen their vision of the future. Better snow data means better predictions of sea ice stability, river flows, permafrost thaw, and even global weather patterns that are influenced by the pulse of heat and moisture escaping from a less insulated Arctic.
The Sound of Snow, Reconsidered
Imagine standing once more on that silent Arctic plain. The sky is pale, the air so cold it feels metallic in your lungs. You listen—not just for the hiss of new snow but for the deeper, slower music of a changing climate. Somewhere beneath your boots lies a half-century of numbers: depths, densities, dates. They are not perfect. They never were. But they are still the best record we have of how this frozen world has breathed in and out through winter after winter.
The scientists rethinking those records are not trying to rewrite reality; they are trying to get closer to it. In doing so, they reveal something about science itself—not as a tidy procession of facts, but as a long, careful conversation with the world, full of revisions and second looks. The Arctic’s snow is speaking in new ways now, drifting into patterns no one has seen before. To hear it clearly, we have to acknowledge how much of its voice we may have misheard.
In that effort, the stakes extend well beyond the Arctic Circle. The timing of a melt, the depth of a drift, the brightness of a snowfield seen from orbit—these details ping outward through models, policies, and predictions that shape how humanity braces for the century ahead. Rethinking 60 years of Arctic snow data is more than a matter of scientific housekeeping. It is part of learning, finally, to listen closely to the quietest season of a rapidly changing planet.
Frequently Asked Questions
Why are scientists questioning data that has been used for decades?
Scientists are discovering that long-term Arctic snow records contain hidden biases from station relocations, changing instruments, evolving observation methods, and shifts in the landscape itself. As the Arctic warms and snow becomes more variable, these small issues can significantly distort trends, so the data need to be carefully reanalyzed rather than accepted at face value.
Does this mean we don’t know how Arctic snow has changed?
We still have a broad understanding that Arctic snow is arriving later, melting earlier, and undergoing more freeze–thaw cycles. The rethinking mainly affects the fine details: how fast specific trends are happening, how they vary from one region to another, and how accurately they have been captured by past instruments and models.
How do satellites fit into this reassessment?
Satellites provide wide-area coverage but can misinterpret complex snowpacks, vegetation, and ice layers. Scientists now compare satellite readings with intensive field measurements and older station records, using mismatches to identify weaknesses in both systems and to build better combined datasets.
What role does Indigenous knowledge play?
Indigenous communities have generations of experience reading snow conditions for travel, hunting, and herding. Their observations about shifting freeze-up dates, dangerous ice, and changing snow quality offer independent evidence that can highlight gaps or errors in scientific records and help guide where and how new measurements should be taken.
Will correcting the snow data change climate predictions?
Improved snow data will refine climate and hydrological models, especially in the Arctic. It may adjust the timing and magnitude of some projections—such as river runoff, sea-ice stability, or permafrost thaw rates—but it does not overturn the fundamental conclusion that the Arctic is warming rapidly due to human-driven climate change.
Why focus so much on snow depth and snow water equivalent?
Snow depth and snow water equivalent control how much sunlight is reflected, how much water is stored for spring melt, and how stable sea ice and overland travel routes are. These measurements are central to understanding energy balance, ecosystems, and human safety in the Arctic, so their accuracy is crucial.
Can we fix past data that were measured with older tools?
We can’t redo past winters, but we can reinterpret their numbers. By understanding how older instruments behaved, identifying breaks and biases in records, and comparing them with newer, more detailed measurements, scientists can adjust and better contextualize historical data, turning an imperfect archive into a more reliable foundation for future work.